In this section, we will introduce Shiny, an R package used to make interactive web apps. Unlike other R packages, the shiny package has a more specialized syntax and can take some more work to learn. In particular, the concept of reactivity presents some challenges to coding and debugging that we have not yet seen in this course.
The purpose of the following exercises is to give an idea about the types of apps that are possible with shiny.
Exercise 1. Many students and faculty at St. Lawrence have used Shiny for some really cool projects! Some of these are stored at https://stlawu.shinyapps.io/index/. Choose an app from either the tab for SYE projects or the tab for Summer Research projects and answer the following questions.
What makes the app interactive? In other words, what is a user allowed to change in the app?
What are the outputs of the app? In other words, what in the app updates when you change some of the things you described in part (a).
Write a short one paragraph description describing the app you selected, what makes it interactive, and something interesting that you found while exploring the app.
Exercise 2. Choose another app from the SYE or the summer research tab at https://stlawu.shinyapps.io/index/. Answer the following questions.
What makes the app interactive? In other words, what is a user allowed to change in the app?
What are the outputs of the app? In other words, what in the app updates when you change some of the things you described in part (a).
Next, to introduce yourself to some basic Shiny code syntax, read Chapter 1 of the Mastering Shiny textbook by Wickham: https://mastering-shiny.org/basic-app.html. Make sure that you can run the code in this section as you are reading along.
Exercise 3. At the end of the section, complete the following exercises in 1.8 Exercises: Exercise 2, Exercise 3, and Exercise 4 (for this exercise, you should actually make the reactive expression that helps reduce the code duplication).
14.2 Our First App: SLU Majors
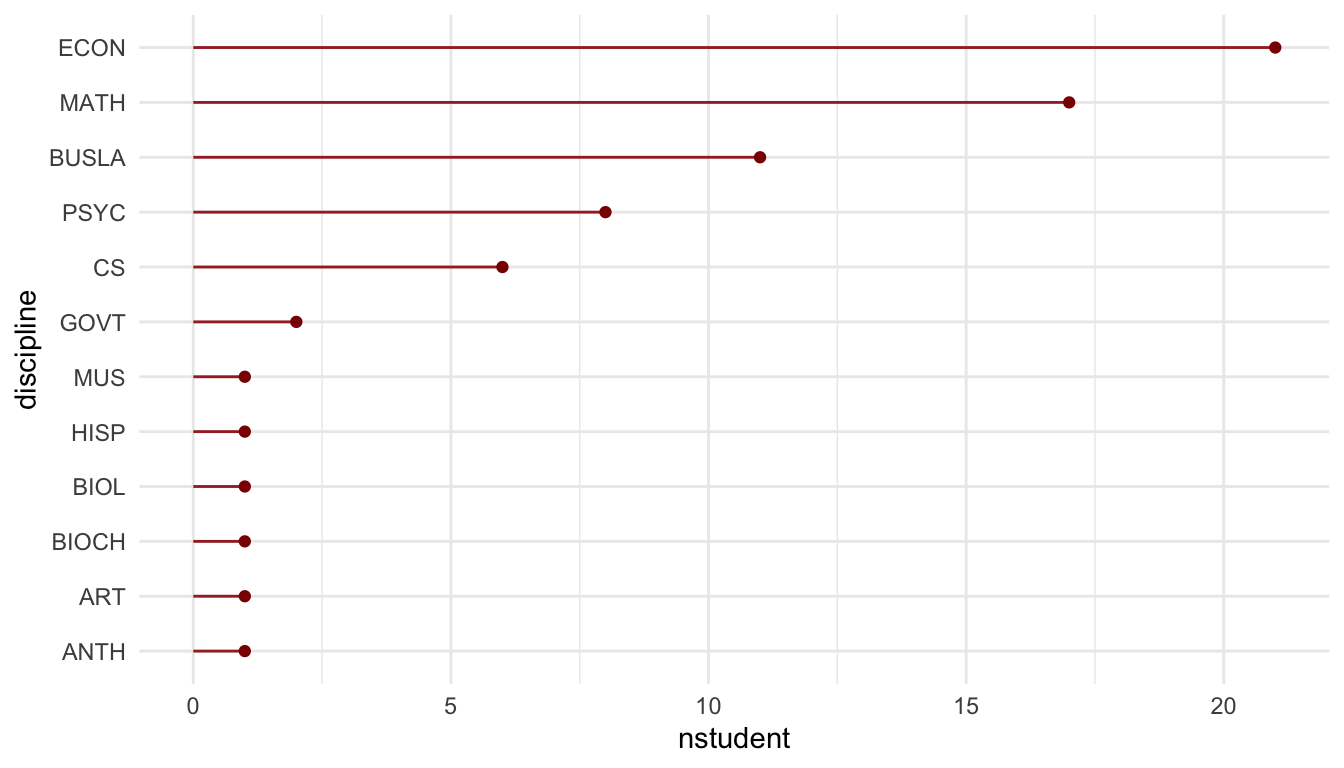
We will use the SLU majors data set to build our very first shiny app. Recall that we made a graph that showed the “other” majors of graduating SLU STAT majors from the past 5 years. However, what if we wanted to allow a user to visually explore this type of graph for any major at SLU?
To accomplish this task, we might consider using shiny to build a web app. A usual starting point would be to make the graph for a single major, which we have already done:
A nice shortcut to creating the “bones” of a shiny app is to type shinyapp in an R chunk and clicking on the shinyapp snippet option that pops up. Doing so should create:
We see a couple of components: a ui component, a server function, and a line that will eventually run the app with the shinyApp() function. Go ahead and run each line of code here. After running shinyApp(ui, server), a blank webpage should pull up. This is blank because we haven’t put anything in our shiny app yet!
Once you’re done gazing at the blank page, you can return to R Studio and click the red STOP button in the upper-right corner of the console window. Doing so will cause the shiny app to terminate and will allow you to run regular R code again.
Now that we know a little more about the basic components of shiny, we can start to think about how to build up our app. I find shiny quite challenging to get started with, but the shiny cheatsheet, along with good old StackExchange and StackOverflow can help.
To get us started, we will build this SLU majors App as a class. The SLU Majors app will cover a very common case of interaction: allowing the user to choose a value of a variable to filter() by. Note that the course materials site does not support Shiny apps so you will need to run all of the code yourself to view all of the app output.
ImportantImportant
The following gives a loose outline of how I would proceed to construct the SLU majors app. Note that, because debugging is more challenging in shiny, I find that making the app in a slow step-by-step fashion to be the best strategy.
Step 1: Build a static version of the app you want to create. Typically, to do this, you’ll have to choose particular values for what you want the user of the app to eventually be able to change. We have already completed this step by making the graph for STAT majors.
Step 2: Decide on and set up an input for the User Interface, UI. We will do this as a class. A common UI set-up is to use the sidebarLayout() that creates a side bar (that often has user inputs) and a main panel (that often has the resulting plots and tables).
Step 3: Put the static graph (or table) in the server function.
Step 4: Connect the UI selection input to the server, possibly creating a reactive value. Anything that is reactive must go inside a reactive({}) expression, or a render_({}) expression.
14.3 Your Turn
Exercise 1. Add an input option to the UI that gives the user control over how many double majors, at minimum, should be present to be included in the plot. Currently, that minimum is 1. Then, update the server so that the app reflects the user’s change.
Exercise 2. Look at the limited choices section of the UI Chapter of Mastering Shiny. In the SLU majors app, add a radioButtons input that allows the user to select major or minor. Then, change the server of the app so that the resulting plot gives the double majors if the user selects major and the minors if the user selects minor. To accomplish this, you can either use a base Rifelse statement, or you can use str_detect().