Creates a default map for the predictions of unobserved sites. Note that all predictions are stored
in a data frame in the output of predict.slmfit(). Therefore, if a user
would like to create his or her own plot, they can easily do so using
this data frame.
# S3 method for predict.slmfit
plot(x, ...)
Arguments
- x
the output of the
predict.slmfit()function, of classpredict.slmfit- ...
further arguments passed to or from other methods.
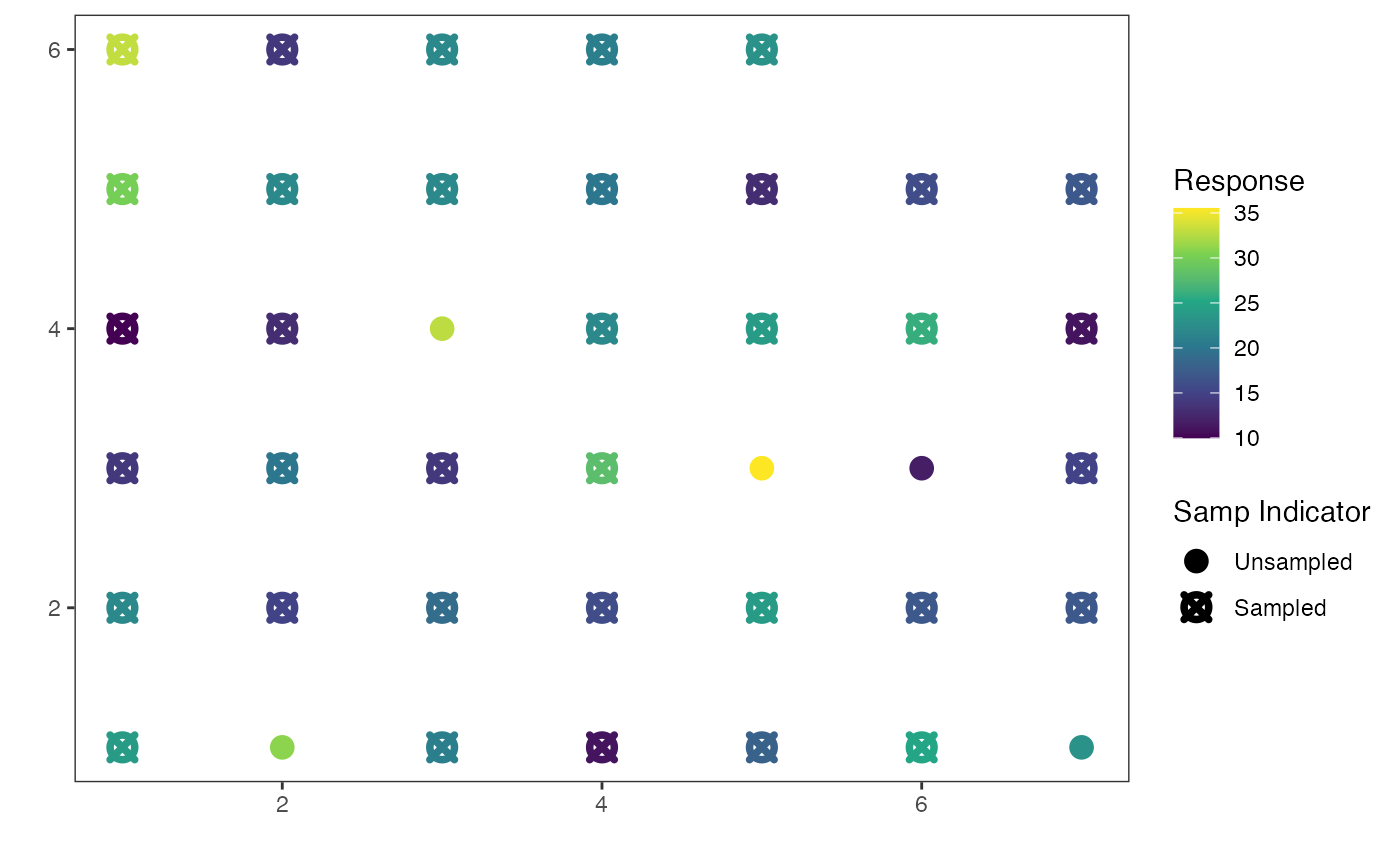
Value
a plot with x-coordinates on the x-axis and y-coordinates on the y-axis that is coloured by predictions, with points with an X denoting that a site was sampled and filled circles denoting unsampled sites.